
Necessary Conditions for Successful Application of Intra- and Inter-class Common Vector Classifiers
In this study, classification performances and inherent characteristics of two variations of the common vector approach (CVA), namely the mutual CVA and the discriminative CVA (DCVA), are investigated, especially for images that contain a shared background, including binary images. Although recent papers mainly emphasize the superiority of DCVA as the preferred subspace method over certain examples, two major risks are investigated in this work. The first risk case emerges when the dimension of the feature vector falls below the number of training samples, which easily occurs with the discriminative methods. Besides, it was observed that data augmentation using additional concatenation of fixed backgrounds does not help DCVA for this problem, either. The second case was observed particularly during the classification of binary images, where CVA outperforms its discriminative version. Although CVA and DCVA are well-known methods, the experimental results indicate that their application needs careful consideration of training data size. Once the necessary attention is paid, CVA is capable of outperforming many classifiers, including support vector machines (SVM). This study puts an assessment of conditions on CVA variants for their successful application in image classification
Experimental Work with the Kimia 99 Shape Database
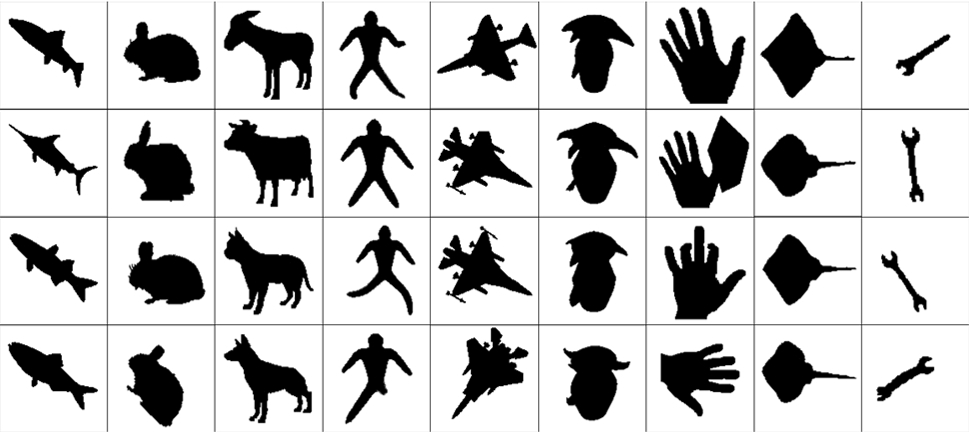
The Kimia 99 shape database is well known among shape matching and recognition literature [41]. It includes 99 binary images from nine categories (Fig. 1; each row is a category). Since this work aims to demonstrate CVA performance under image sets with shared pixel values, a pre-processing of shape orientation and size alignment is applied. Then, the images are scaled back to a fixed size of 128×128 pixels.
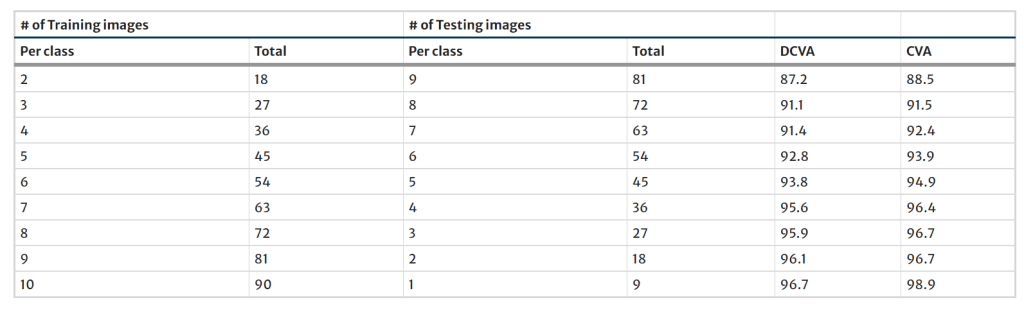
Following this process, these shape images are used as training or testing sets for the assessment of the classification performance using both CVA and DCVA methods. The training–testing group sizes were gradually incremented from a ratio of 2/9 to 10/1, while randomly shuffling and folding the train–test sets as many times as the number of images let. The obtained recognition accuracy results are given in Table 1 by averaging the above-mentioned random folds. It is noteworthy to see that CVA classification performance is persistently better than that of DCVA, regardless of the number of used training samples.
Experimental Work with the TARI-1000 Shape Database
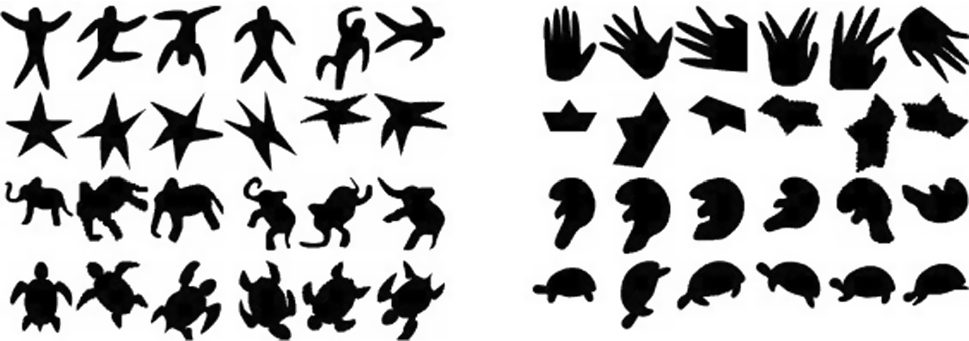
TARI-1000 shape database [42] is a larger and popular database for shape matching studies. It consists of 1000 binary images from 50 shape categories with 20 images per category. Some of these categories, such as brick, cattle, cellular phone, face, flatfish, fountain, key, ray, teddy, watch, are also included in the MPEG-7 database. These images are also at the size of 128 × 128, and some examples are presented in Fig. 2.
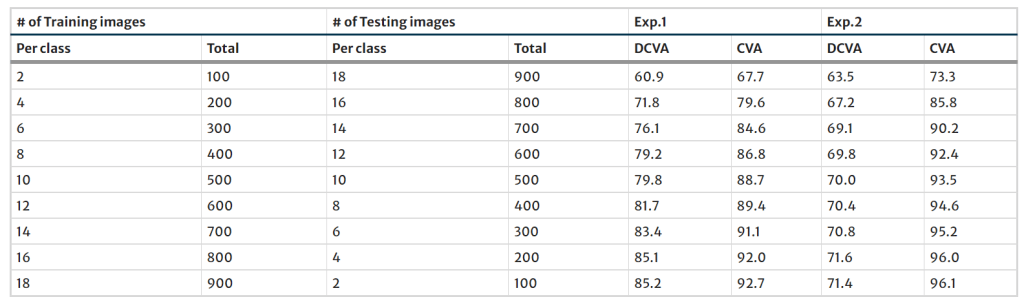
In the first experiment (Exp.1), the similar preprocessing steps as in the Kimia 99 database are applied to the TARI-1000 database. All of the shape images are, again, classified by the CVA and DCVA methods by the use of a cross-validation procedure that is randomly repeated 10 times. The different numbers of images (from 2 to 18 images) are randomly selected for the training set, whereas the rest of the images are used for the test set. The obtained recognition accuracies are given in Table 2.
As a further attempt to increase the overall size of the image database, the 180∘ rotated, mirrored, and 180∘ rotated-and-mirrored versions are added to the database. The obtained recognition accuracies for the extended version experiments (Exp. 2) are given in Table 2. The results for the TARI and extended-TARI databases show that CVA outperforms DCVA regardless of the number of training images.
Experimental Work with the AR Face Database
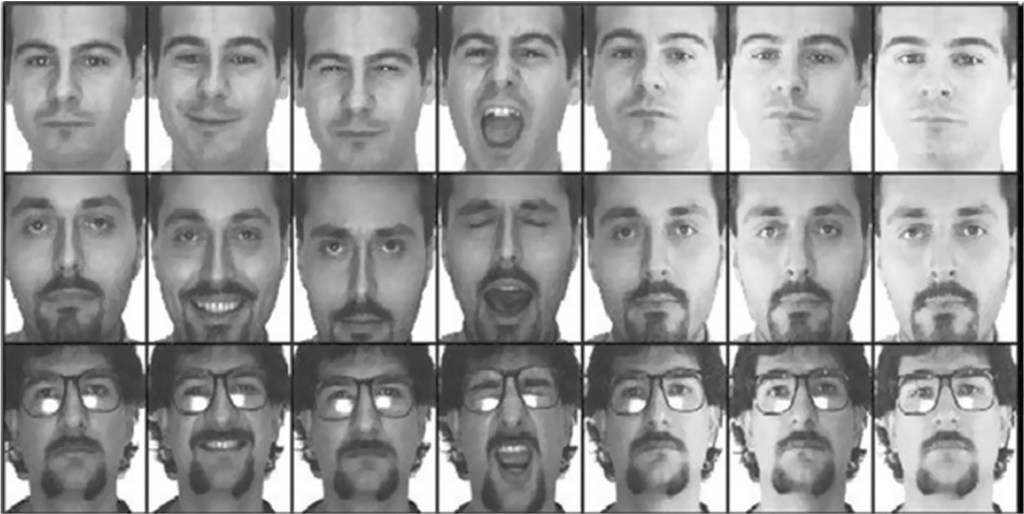
The AR face database, constructed by Martinez and Benavente [43], comprises RGB (Red–Green–Blue) formatted face images of 126 distinct persons. The face poses for each person include 26 different face expressions, lighting situations, or irregular occlusions. Each image was originally rendered at a size of 576 × 768 pixels. Following the usual pre-processing operations of converting to gray-scale, fixing the eye coordinates, cropping and resizing, the final size of the images was chosen to be 74 × 56 pixels. A subset of this database with 30 male and 20 female subjects were selected to make this work compatible with [22]. Figure 3 shows the face portions of arbitrarily selected three persons from the utilized database.
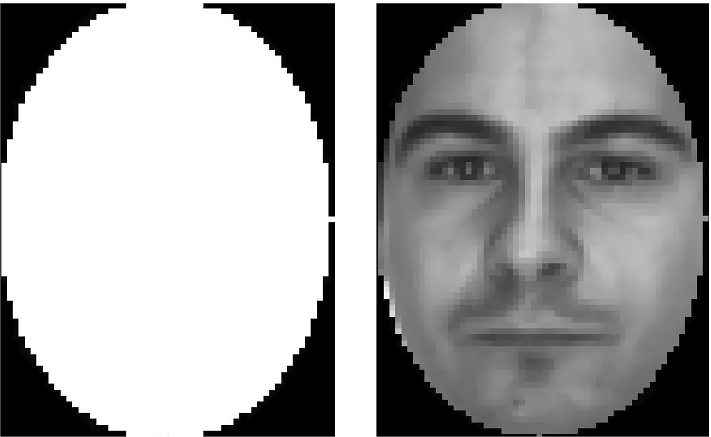
Several experiments were conducted on the AR face database to test the effect of image background on recognition with CVA and DCVA. The same experiments were performed with the benchmark of SVM to show that CVA alternatives stand well against the state-of-the-art. The training stage uses N randomly selected images from each subject for all experiments, making a training set size of N×50 images. The remaining 700−N images are used for testing. This procedure is repeated ten times, and the results are obtained by averaging. The first experimental variant is obtained by applying an elliptical mask to remove the background. The mask and a sample masked image are given in Fig. 4.
Then, in order to observe the effect of background pixel count, the masked image is placed at the center of textured or constant background images as shown in Fig. 5. Several variations with different number of background pixels and gray-scale background values could be tried in order to explore their effects on the classification performance. In order to span a wide class of variation and state the research argument, the first background was selected as an arbitrary gray-scale image (named as ”trees” ), and the second one is chosen as a uniform black. Therefore, the adequate possible conditions for a background are addressed in terms of classification accuracy. Since additional regions from the background grow the image size to 300×200, the images were re-scaled to the original working size of 90×66. It must be noted that the process reduces the discriminating pixel count from 3249 to 326. The classification performances of CVA and DCVA on three extensions of AR face database with virtual backgrounds were compared. The results with their standard deviation values are given in Table 3.
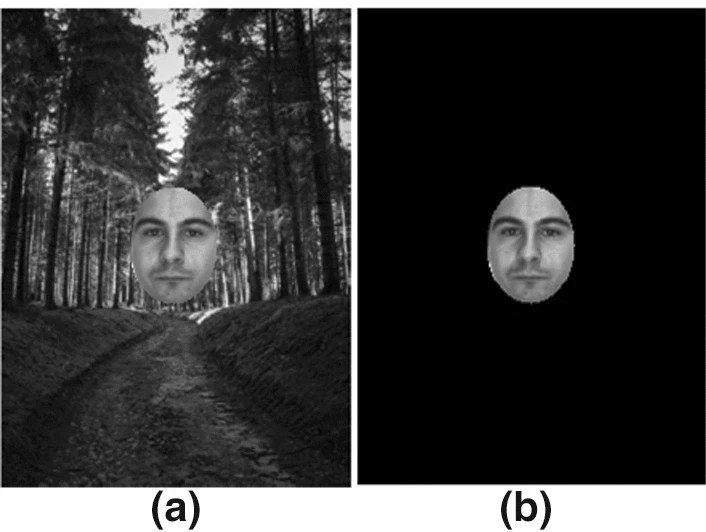
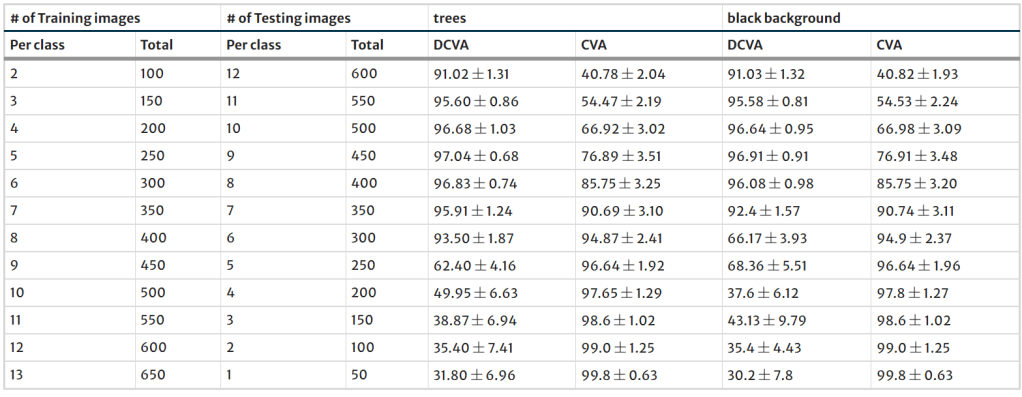
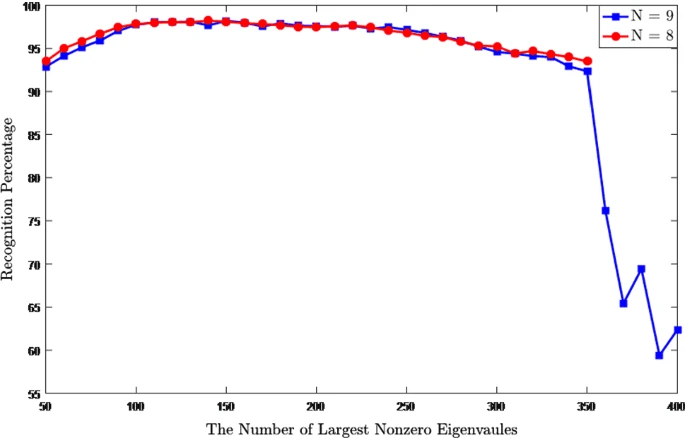
Figure 6 illustrates the classification performance of DCVA with respect to the decreasing number of eigenvalues of the range space of total within-class covariance matrix, ΦT. The range space of ΦT has C(N−1) nonzero eigenvalues, e.g., if N=8 and C=50, the dimension of the range space of ΦT is 350. In DCVA, when generating the common vectors, so many eigenvalues are used. However, Fig. 6 shows that the recognition performance of DCVA is generally high when the eigenvectors corresponding to the smallest nonzero eigenvalues are removed for decreasing the dimension of the range space.
If one compares the CVA and DCVA methods according to the classification distance variability, the separation between the incorrect and correct projections (Fig. 7-(i): (a) and (b), yellow bars) is well observed for CVA, whereas the same separation for DCVA (Fig. 7-(i): (c) and (d), yellow bars) shows that a clear threshold is not possible when the ±-variances are considered. This indicates that the DCVA classifier is expected to have lower recognition performance than the CVA classifier. On the other hand, if this comparison is made for the case N=5 (Fig. 7-(ii)), the variability for DCVA is larger than that of CVA; therefore, DCVA is superior to CVA in terms of recognition accuracy.

This study was published in Arabian Journal for Science and Engineering. Want to read more? Here is the link: https://link.springer.com/article/10.1007/s13369-021-06509-3.
